Description
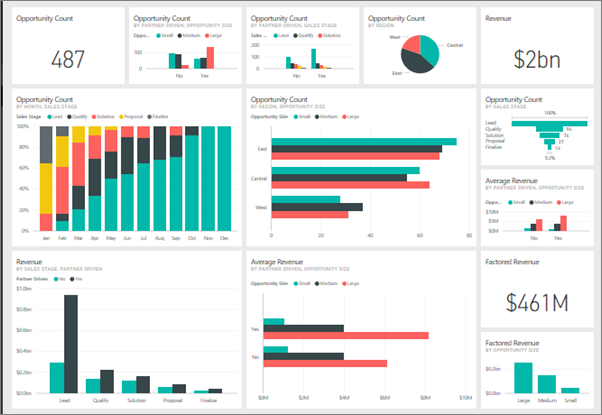
Turn your data into visuals with advanced data-analysis tools, AI capabilities, and a user-friendly report-creation tool using Power BI. Smokeball's Power BI connector allows you to surface Smokeball financial data within Power BI and use this to configure your own bespoke dashboards and business insights.
Media
Features
Sharpen your skills
Get step-by-step guidance and explore key Power BI capabilities by taking Microsoft training courses.
Power BI Desktop
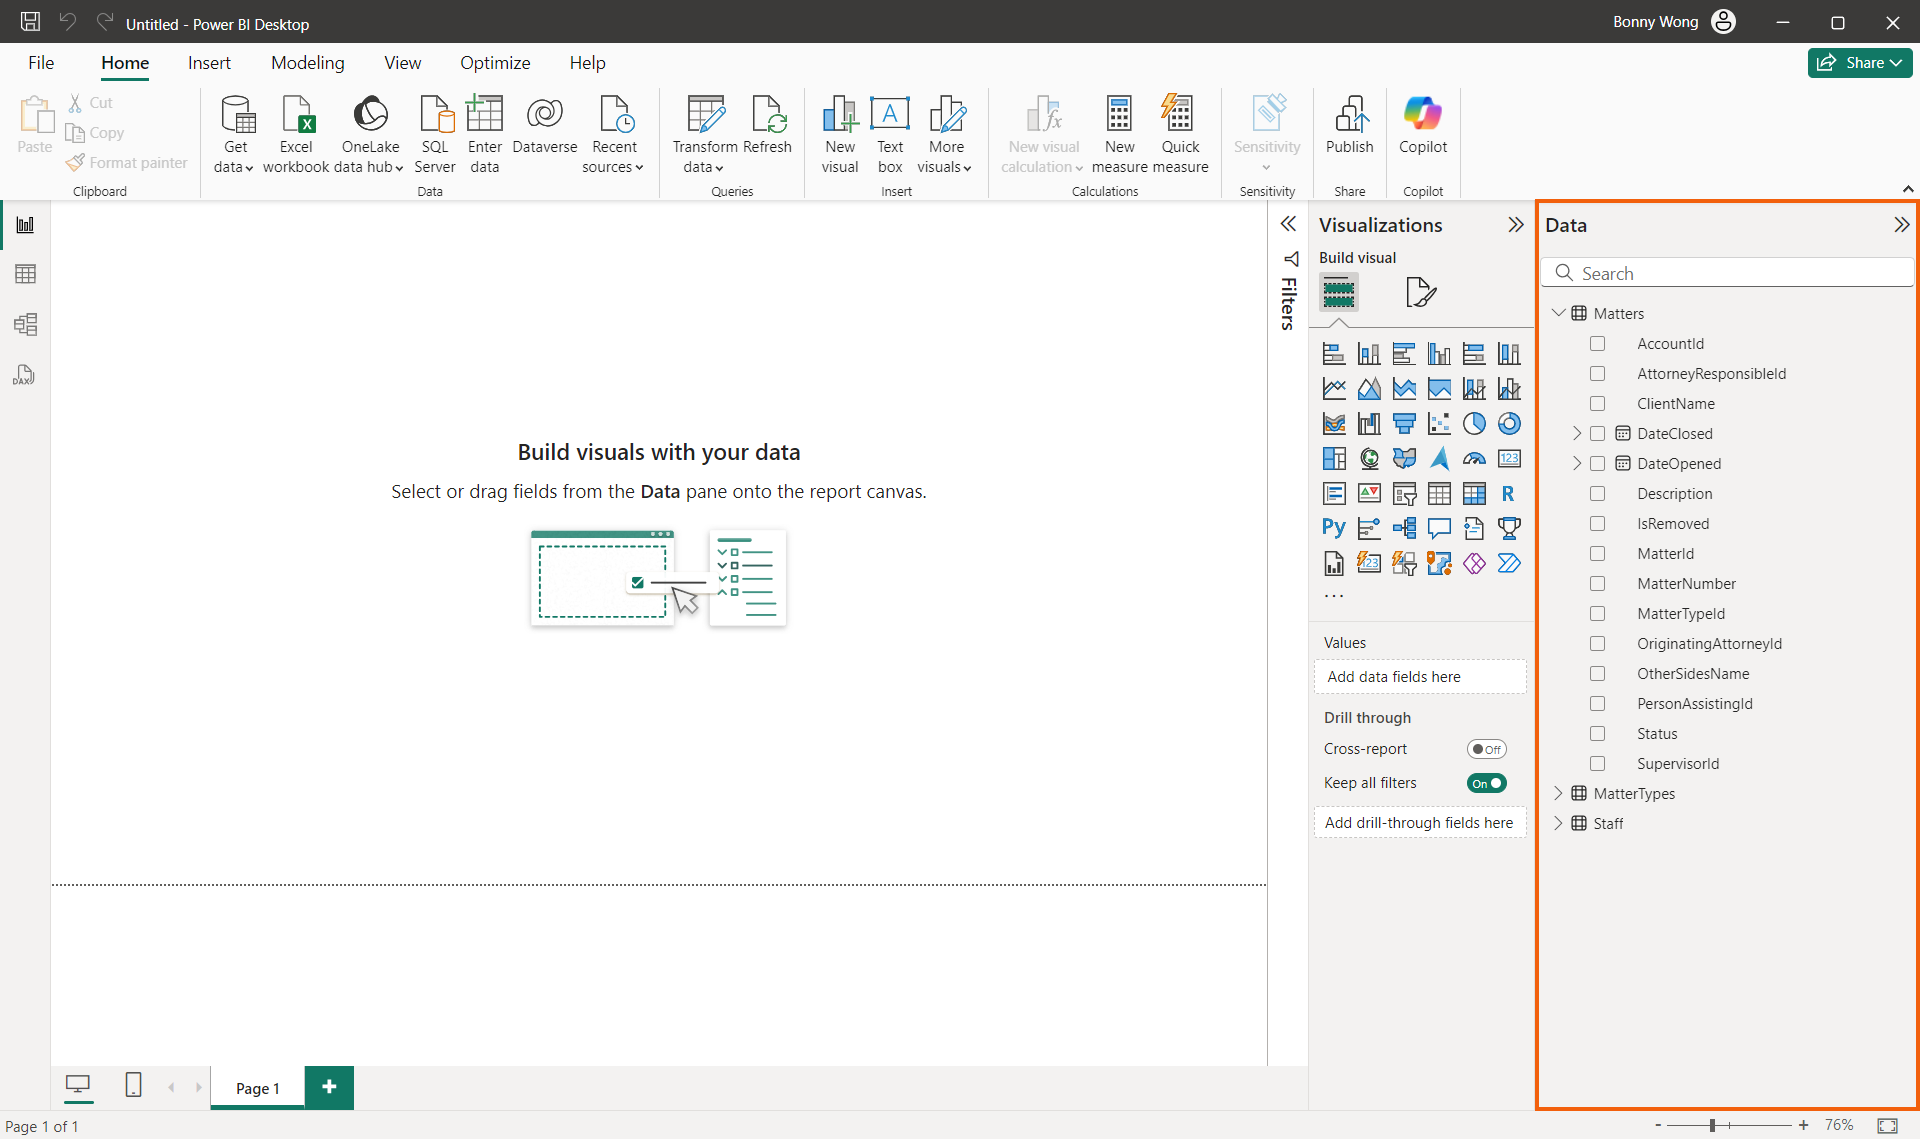
Use the free app to connect, model, and visualize data with an easy-to-use report canvas and hundreds of visuals.
Turn insights into impact
Help users make better decisions by infusing insights into the apps they use every day.
Uncover insights with AI
Turn your data into visuals with advanced data-analysis tools, AI capabilities, and a user-friendly report-creation tool.


